3/12/2008 Wed
An Excellent Trading Day
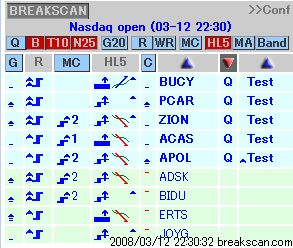
KLAC, BUCY, and ACAS
Gapper's
Eye utilizes our original unique stock scanner, Break Scan, and sophisticated
chart software, CQG. With nominal fee, the Break Scan is available to our
members.
The Kamikaze Gap Play
was introduced to the U.S. traders in the
August 2005 issue of Active Trader Magazine.
@
@
The Nasdaq gapped up on the
open.

The green dot indicates the opening
price.
@
Excerpts from Net Aid:
2008-03-12 22:06:52 hatch shadow
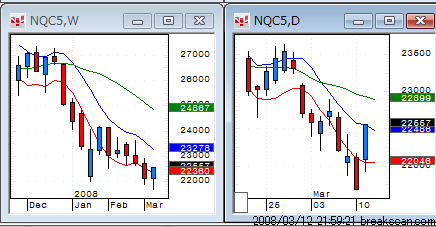
Yesterday, the Nasdaq closed strong.
2008-03-12 22:07:03 hatch shadow
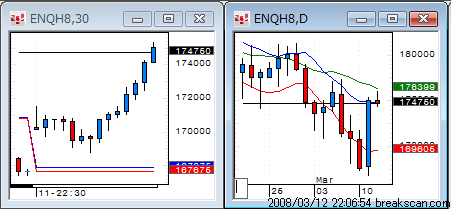
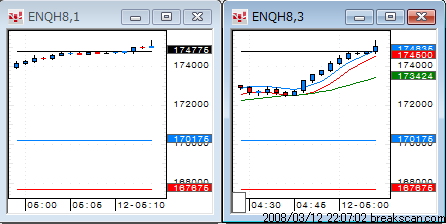
Currently, the futures are flat.
@
2008-03-12 22:07:56 hatch shadow
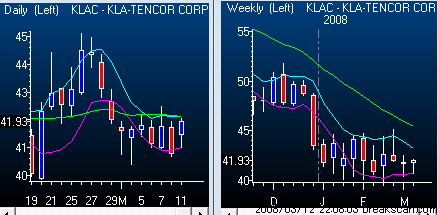
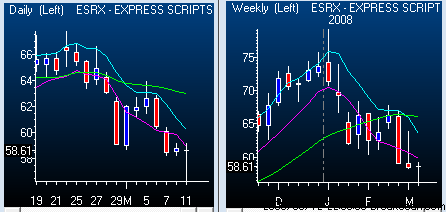
KLAC is a short candidate.
2008-03-12 22:08:32 hatch shadow
It will open at a 5-day low.
2008-03-12 22:08:48 hatch shadow
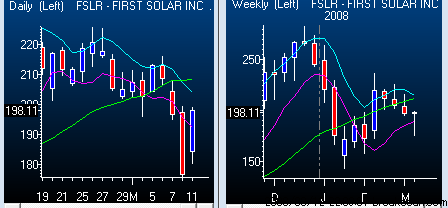
drqw is another short prospect. @
2008-03-12 22:09:14 hatch shadow
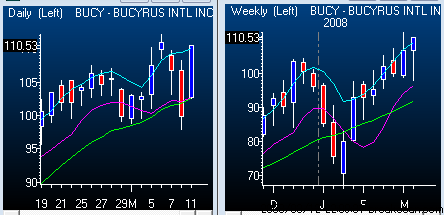
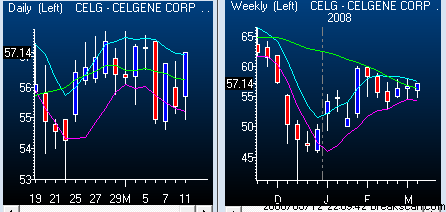
Long candidates are: erkq
2008-03-12 22:09:44 hatch shadow
atbx
2008-03-12 22:09:54 hatch shadow
bdkf
2008-03-12 22:10:13 hatch shadow
bgqv
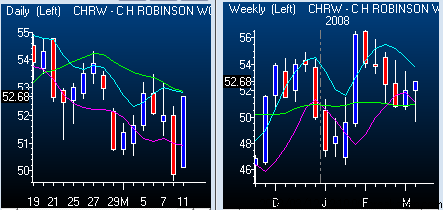
2008-03-12 22:10:29 hatch shadow
dwoc
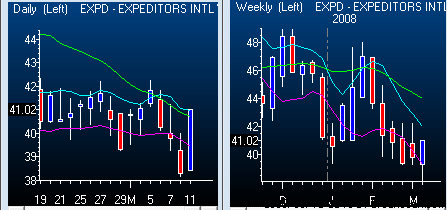
2008-03-12 22:10:42 hatch shadow
fdmy
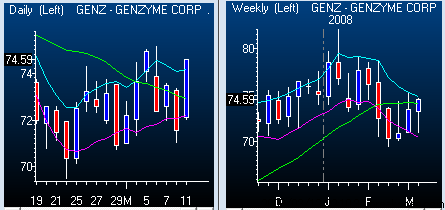
2008-03-12 22:10:52 hatch shadow
inxf
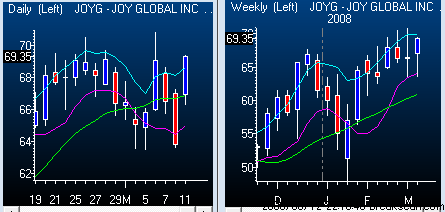
2008-03-12 22:11:05 hatch shadow
msqr
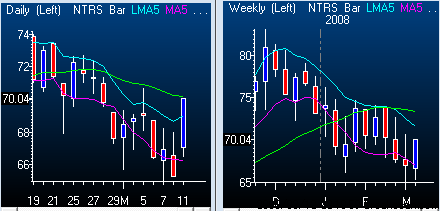
2008-03-12 22:11:18 hatch shadow
ob`q
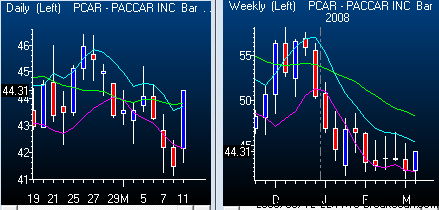
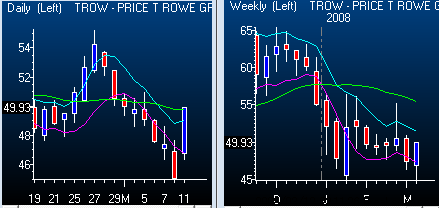
2008-03-12 22:11:40 hatch shadow
sqnv
2008-03-12 22:11:47 hatch shadow
yhnm
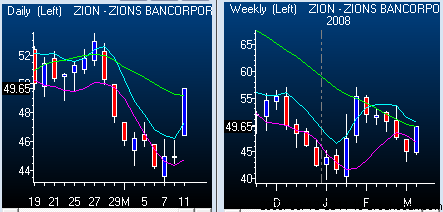
@
2008-03-12 22:30:13 hatch shadow
The market has started.
2008-03-12 22:30:37 hatch shadow
ahct@atbx yhnm@`b`r@

Up $100 for 200 shares

Up $200 for 1000 shares.
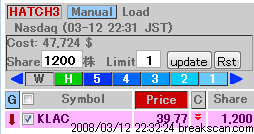
2008-03-12 22:31:52 hatch shadow
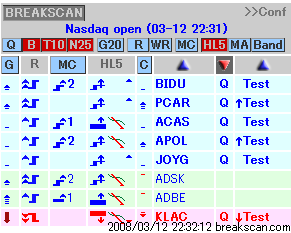
Short jk`b

Up $720 for 1200 shares
2008-03-12 22:31:53 hatch shadow
t`t`

Up $820 for 1000 shares.
@

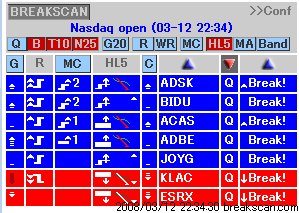
2008-03-12 22:34:36 hatch shadow
inxf
@

Up $505 for 500 shares
@
@
2008-03-12 22:35:02 hatch shadow
mc`p

Up $450 for 1000 shares
2008-03-12 22:48:08 hatch shadow
Short jk`b

@
2008-03-12 22:49:20 hatch shadow
ahct

Up $280 for 100 shares
2008-03-12 22:49:58 hatch shadow
ahct@`lfm@

Up $150 for 500 shares
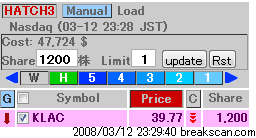
2008-03-12 23:27:28 hatch shadow
ExitI

Up $1620 for 1200 shares

@

It finished even lower. 
@
@
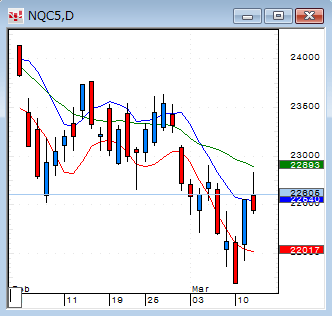
The index finished down.
@
@
Gapper's Eye Index
Daytradenet Top
Charts courtesy of CQG
Source: 2006 CQG, Inc. All rights reserved worldwide.

Red
and blue zones show the gap of the preceding day.
The Green zone indicates the profitable zone of trading.