2008-01-22
23:00:11 hatch shadow
Good evening.
2008-01-22 23:02:08 hatch
shadow
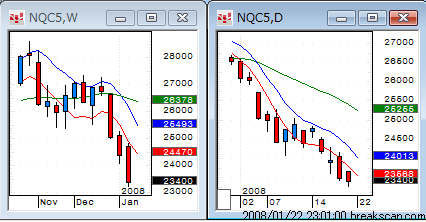
The Nasdaq lost two straight sessions. Currently, the futures
are very weak.
2008-01-22 23:02:46 hatch
shadow
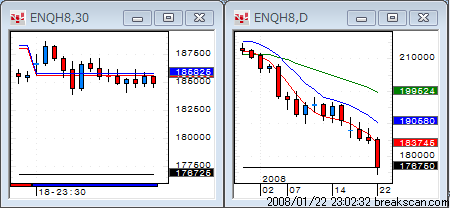
Here are the futures charts.
2008-01-22 23:03:08 hatch
shadow
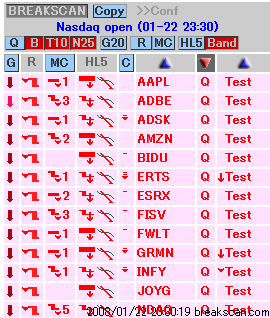
Many stocks will be opening lower.
2008-01-22 23:03:44 hatch
shadow
The biggest downside gap belongs to GOOG. It is nearly down 38 points.
2008-01-22 23:03:59 hatch
shadow
BIDU is down more than 32 points.
2008-01-22 23:04:03 はっちshadow
FSLR is down 20 points.
2008-01-22 23:04:22 hatch
shadow
Most of stocks are down. We will focus on short, but watch out
for a reversal.
2008-01-22 23:06:04 hatch
shadow
These are stocks with relatively good weekly and daily chart
patterns: APOL, BMRN, TEVA, GENZ and GILD. Although the weekly
chart is not good, CELG has a good daily chart.
2008-01-22
23:30:04 hatch shadow
The market has started.
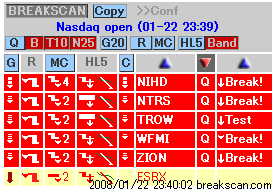
2008-01-22 23:30:26 hatch
shadow
All red !
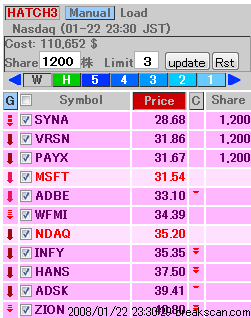
2008-01-22 23:30:35 hatch
shadow
Hatch 3.
2008-01-22 23:30:46 hatch
shadow
Long GOOG.

Up $530 for 50 shares.
2008-01-22 23:30:58 hatch
shadow
Long BIDU.

Up $530 and $1050 for 100 shares each.
2008-01-22 23:31:10 hatch
shadow
CELG and BIIB.

Up $725 for 500 shares.

Up $500 for 500 shares.
2008-01-22 23:33:17 hatch
shadow
APOL

Up $1110 for 500 shares.
2008-01-22 23:33:31 hatch
shadow
Long AAPL

Up $1020 for 200 shares.
2008-01-22 23:35:52 hatch
shadow
ISRG

Up $511 for 100 shares.
2008-01-22 23:39:06 hatch
shadow
MELI

Up $2120 for 500 shares.
2008-01-22 23:41:45 hatch
shadow
GOOG

Up $506 for 50 shares.
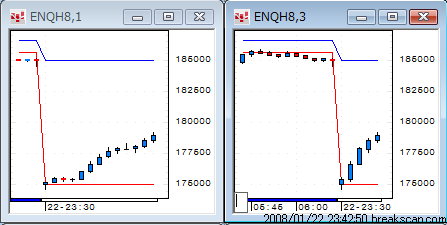
2008-01-22 23:42:54 hatch
shadow
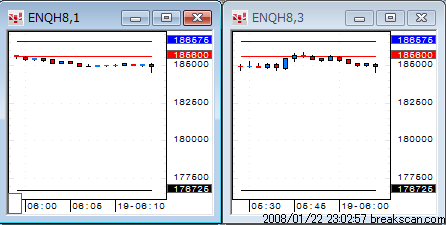
Here are the futures charts.
2008-01-22 23:46:55 hatch
shadow
FMCN

Up $535 for 500 shares.
2008-01-22 23:47:37 hatch
shadow
AAPL

Up $312 for 200 shares.
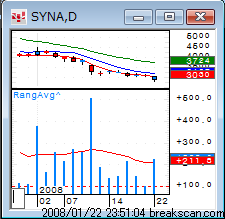
2008-01-22 23:51:16 はっちshadow
SYNA hit the average daily range.
2008-01-22 23:53:50 hatch
shadow
FWLT and PCLN

Up $400 for 200 shares.

SYNA hit the upper boundary. It was a good place to short
the issue.
2008-01-23
00:29:22 hatch shadow
SYNA also moved above the average daily range. Don't insist
short this one.

2008-01-23
00:29:36 hatch shadow
I don't think you will lose that much if you can short it near
the upper boundary. But, if you are not comfortable with the
idea, don't do it !

After all it made $1020 profits on 1200 shares

