Daytradenet Top へ戻る
ガイドの Top へ戻る
Study を使って週足や日足がアップトレンドの銘柄を調べる
週足を選択する Condition を作成
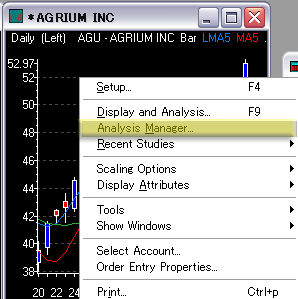
まず日足チャートの上で右クリックすると表示されるメニューから
Analysis Manager を選択します。
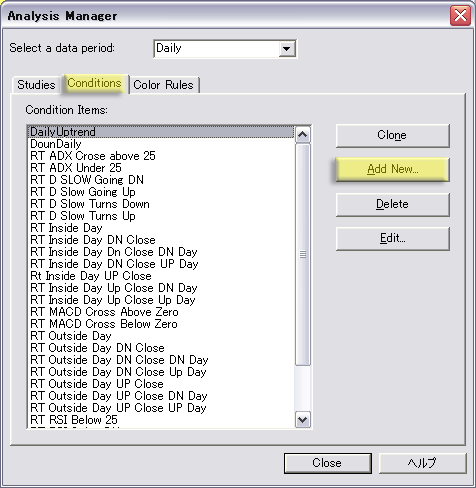
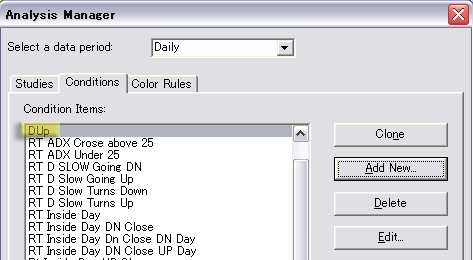
Condition のタブを選択し Daily を 選択してから Add
New をクリックします。
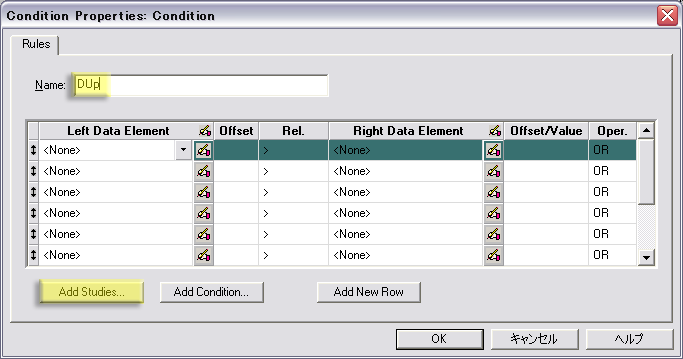
Name に Dup (Daily Uptrend)
と適当な名前をつけます。
Left Data Element へカーソルを移動し Add
Studies をクリック。
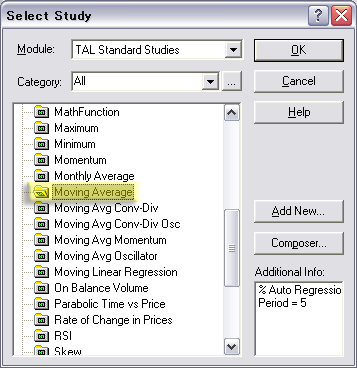
Moving Average を選択し ダブルクリックします。
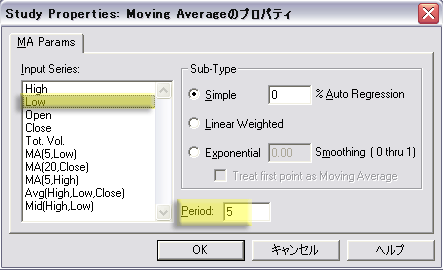
ダブルクリックでパラメータを設定する画面が開きます。
ハイバンドのLow の5日移動平均線なので Period
へ 5 を設定して OK ボタンをクリック。
このように Left Data
Element へ 5日のローバンドという項目が設定されました。
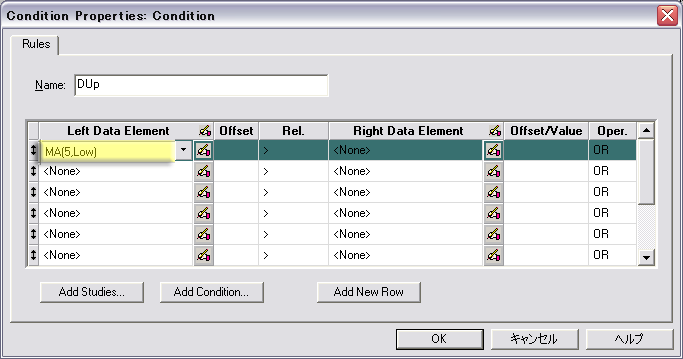
このようにして、Right
Data Element には 20MAの終値 Close の項目を設定し、右端は AND の条件を設定します。
次の行も同じようにして設定を続け、画面のような設定にしてください。
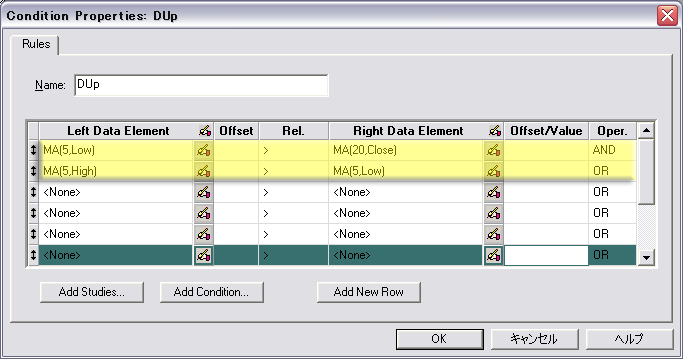
上の行は 5Low は 20MA より 上
次の行は 5hight は 5 Low より 上
という二つの条件を満たす Condition
が作成されることで下の日足チャートの銘柄が選択することができます。
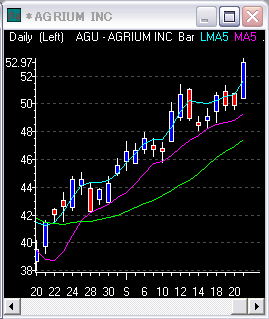
OKで下のように、上の条件のような DUp という
日足で3本の移動平均線の並びのよい銘柄を
選択するための
Condition
が作成されました。
週足を選択する Condition を作成
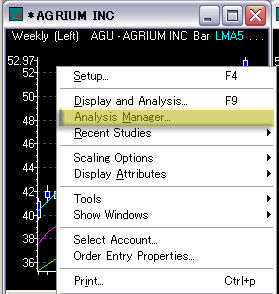
次は週足チャートの上で右クリックすると表示されるメニューから
Analysis Manager を選択します。
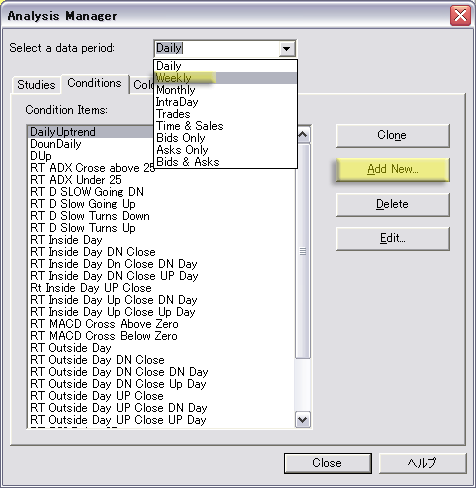
Condition のタブを選択し Weekly を選択し Add New
をクリックします。
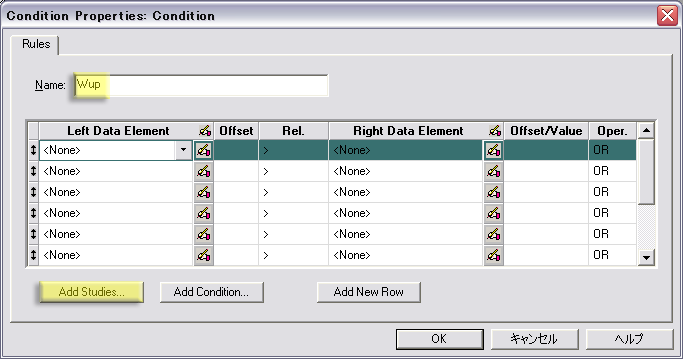
Name に Wup (Weekly Uptrend)
と適当な名前をつけます。
Left Data Element へカーソルを移動し Add
Studies をクリック。
Moving Average を選択し ダブルクリックします。

ダブルクリックでパラメータを設定する画面が開きます。
ハイバンドのHigh と5日の移動平均線なので Period
へ 5 を設定して OK ボタンをクリック。

このように Left Data
Element へ 5日のローバンドという項目が設定されました。
このようにして、Right
Data Element には 20MAの終値 Close の項目を設定し、右端は AND の条件を設定します。
次の行も同じようにして設定を続け、画面のような設定にしてください。
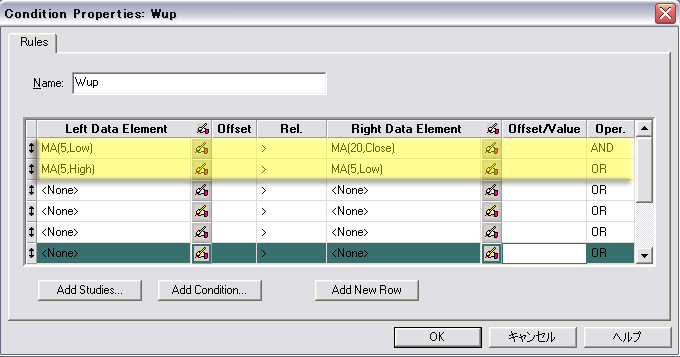
上の行は 5Low は 20MA より 上
次の行は 5hight は 5 Low より 上
という二つの条件を満たす Wup という Condition
が作成されることで下の週足チャートの銘柄が選択することができます。
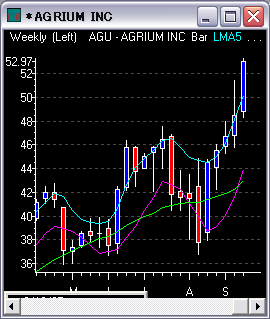
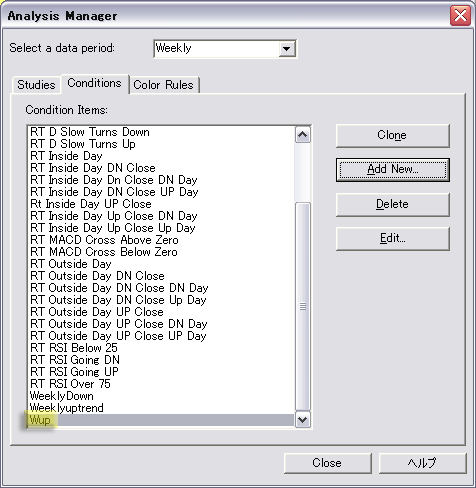
OKで下のように、上の条件のような WUp という
週足で3本の移動平均線の並びのよい銘柄を
選択するための
Condition
が作成されました。
マーケットマインダーへこのコンディションで選択した条件を表示
Market Minder のうえで右クリックすると表表示されるメニューで
Colum Layout Choices > Configure Colum
Layout と選択。
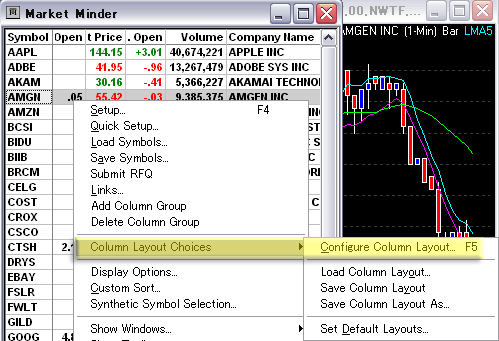
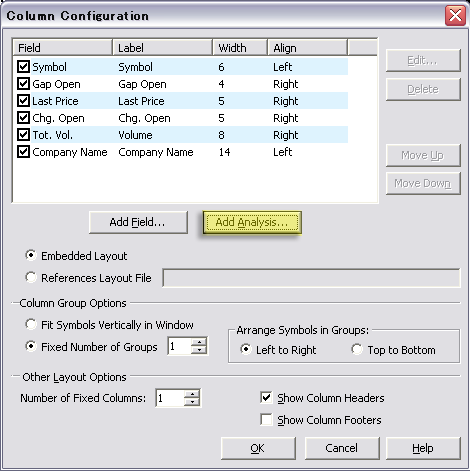
表示される次のようなウィンドウの Add Analysis をクリック。
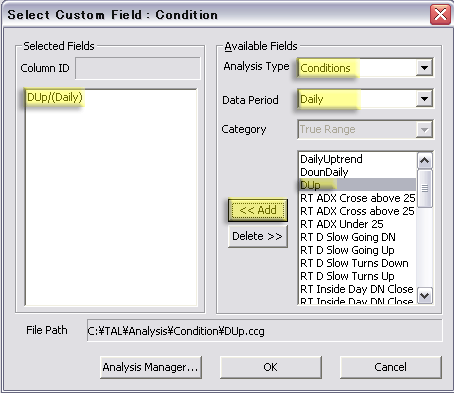
Analysis Type > Conditions
Data Period > Daily
と設定し Add ボタンをクリックして DUp
を左のウィンドウへ表示させます。
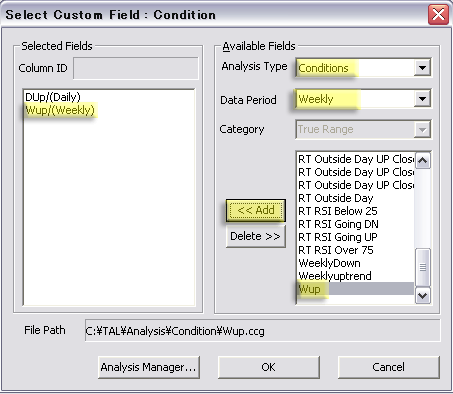
Analysis Type > Conditions
Data Period > Weeklyy
と設定し Add ボタンをクリックして WDUp
を左のウィンドウへ表示させます。
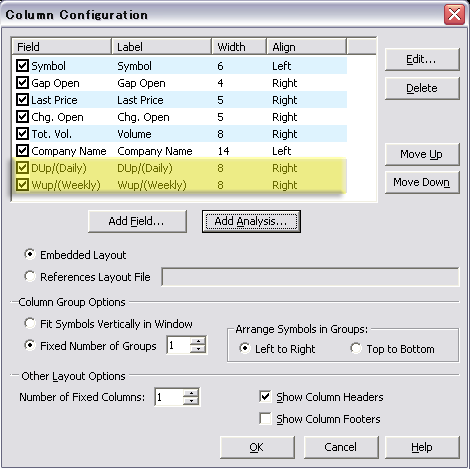
OKをクリックすると下のように項目が自動的に追加されます。
OK をクリックすると下のように表示されます。
True は3本のMAの並びがよい銘柄つまり Condition
で決めた条件にあてはまった銘柄です。
False は条件にあてはまらなかった銘柄です。
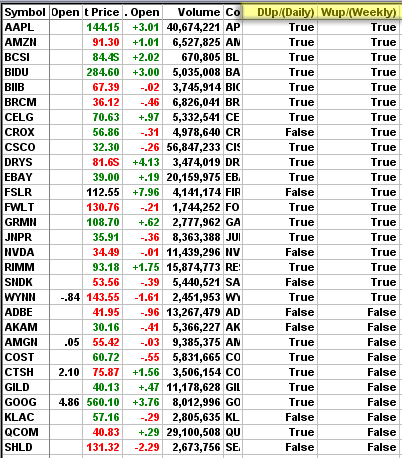
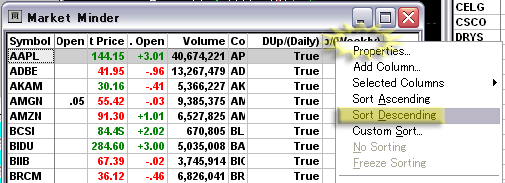
下のようにWup項目を並び替えると・・
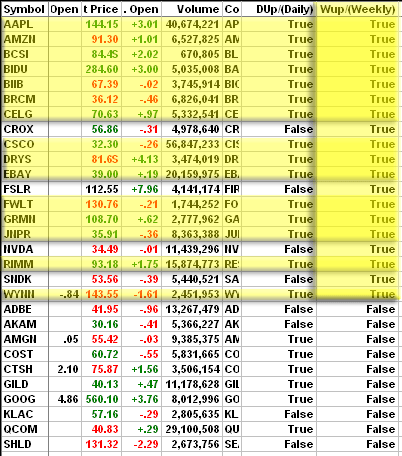
銘柄名が黄色いものが、日足と週足のMAの並びがよい銘柄だということがわかります。
Real Tick に関してのお問い合わせ先
NWT ファイナンシャルグループ
担当:
五十嵐 夕子 さん
メールアドレス yuko@nwtfinancialgroup.com
Real tick は Real tick
社の製品であるため、デイトレードネットは直接関係ありません。
お問い合わせは上記へお願いします。
Daytradenet
Top へ戻る